Lecture 20 - Evaluating ML models: Baselines and Metrics
Announcements
- Project Milestone is in!
- Ethics 3 is out!
- Currently scheduled for next Friday. Should we swap it to Monday?
Goals
- Understand the properties of a good evaluation environment
- Be able to design good baselines for a variety of prediction tasks.
- Know how to think about errors in machine learning systems, and a few ways they can be measured.
- Regression: absolute, relative, squared; MSE, RMSE, MAE, coefficient of determination
- Binary Classification: accuracy, precision, recall, F-score
- Multiclass classification: acccuracy, precision, recall, confusion matrices
So you've made some predictions. How good are they?
How good are they? Assume we're in a supervised setting, so we have some ground truth labels for our training and validation data. Should you call it good and present your results, or keep tweaking your model?
You need an evaluation environment. What do you need to make this?
- Data splits: train, val[idation], and test (terminology varies; the book confusingly calls these train, test, and evaluation)
- Evaluation metrics: hard numbers that you can compare from one run to the next
- Baselines: simple approaches that hint at how hard the problem is, and how well you can expect to do
Make it convenient; make it informative
With good reason, the book recommends that you package all your evaluation machinery into a single-command program (this could also be a single notebook or sequence of cells in a notebook).
You should output your candidate model's performance:
- on all the relevant performance metrics
- in comparison with your baselines and other candidate models
It's also a good idea to output:
- Statistics and/or distributions of errors - Do you have lots of small errors and a few big ones? All medium-sized errors? One giant outlier?
- If your data has natural categories or segments, break the errors out by categories:
- Looking at data over 10 years? Check if your errors are getting better or worse with time.
- Multiclass classification? Look at your accuracy on each class.
- etc.
Baseline Brainstorm
Example prediction problems:
Biomedical image classification: predict whether an MRI scan shows a tumor or not.
- Training data contains 90% non-tumor images (negative examples) and 10% tumor images (positive examples).
Spam email classification: predict whether a message is spam.
- Training data contains equal numbers of spam (positive) and non-spam (negative) examples.
Weather prediction: given all weather measurements from today and prior,
- Predict whether it will rain tomorrow
- Predict the amount of rainfall tomorrow
Body measurements: predict leg length given height
What generic strategies can we extract from the above?
- Flip a coin
- Nearest neighbor
- History repeats
- Predict the most common label
General baseline strategies:
- Guess randomly
- Guess the mean/median/mode
- History repeats itself
Slightly more advanced:
- Single-feature model
- Linear regression
Special mention:
- Upper-bound baselines
Metrics: Regression
Let's consider regression first. Our model is some function that maps an input datapoint to a numerical value:
$y_i^\mathrm{pred} = f(x_i)$
and we have a ground-truth value $y_i^\mathrm{true}$ for $x_i$.
How do we measure how wrong we are?
Error is pretty simple to define:
$y_i^\mathrm{true} - y_i^\mathrm{pred}$
But we want to evaluate our model on the whole train or val set. Average error is a bad idea:
$\sum_i y_i^\mathrm{true} - y_i^\mathrm{pred}$
Absolute error solves this problem:
$|y_i^\mathrm{true} - y_i^\mathrm{pred}|$
Mean absolute error measures performance on a whole train or val set:
$\frac{1}{n} \sum_i |y_i^\mathrm{true} - y_i^\mathrm{pred}$|
Squared error disproportionately punishes larger errors. This may be desirable or not.
$\sum_i \left(y_i^\mathrm{true} - y_i^\mathrm{pred}\right)^2$
Mean squared error (MSE) does the same over a collection of training exaples:
$\frac{1}{n} \sum_i \left(y_i^\mathrm{true} - y_i^\mathrm{pred}\right)^2$
MSE becomes more interpretable if you square-root it, because now it's in the units of the input. This gives us Root Mean Squared Error (RMSE):
$\sqrt{ \frac{1}{n} \sum_i \left(y_i^\mathrm{true} - y_i^\mathrm{pred}\right)^2}$
Problem with any of the above:
You can make your error metric go as small as you want! Just scale the data: $$ X \leftarrow X / k $$ $$ \mathbf{y}^\mathrm{true} \leftarrow \mathbf{y}^\mathrm{true} / k $$ $$ \mathbf{y}^\mathrm{pred} \leftarrow \mathbf{y}^\mathrm{pred} / k $$
Also: Is 10 vs 12 is a bigger error than 1 vs 2?
Solutions:
Relative error:
$|y_i^\mathrm{true} - y_i^\mathrm{pred}|$
Coefficient of determination:
Let $\bar{y}$ be the mean of $\mathbf{y}^\mathrm{true}$.
Let $SS_\mathrm{tot} = \sum_i \left(y_i^\mathrm{true} - \bar{y}\right)^2$.
Let $SS_\mathrm{res} = \sum_i \left(y_i^\mathrm{true} - y_i^\mathrm{pred}\right)^2$.
Then the coefficient of determination, denoted $R^2$, is: $1 - \frac{SS_\mathrm{res}}{SS_\mathrm{tot}}$
Exercise - $R^2$ is:
- ________ if you're perfect
- ________ if you predict the mean
- ________ if you do worse than the mean-prediction baseline!
Metrics: Binary Classification
Evaluating binary classification is trickier than regression, and the reason is that most intuitive metrics can be gamed using a well-chosen baseline.
Simplest metric - accuracy: on what % of the examples were you correct?
There are different kinds of right and wrong:
- TP - True positives (correctly labeled positive)
- TN - True negatives (correctly labeled negative)
- FP - False positives (incorrectly labeled positive; was actually negative)
- FN - False negatives (incorrectly labeled negative; was actually positive)

Exercise: let TP be the number of true positives, and so on for the other three. Define accuracy in terms of these quantities.
Accuracy = $\frac{TP + TN}{(TP + TN + FP + FN)}$
Exercise: Game this metric. Hint: suppose the classes are unbalanced (95% no-tumor, 5% tumor).
Problem: if you just say no cancer all the time, you get 95% accuracy.
Okay, what's really important is how often you're right when you say it's positive:
Precision = $\frac{TP}{(TP + FP)}$
Anything wrong with this?
Problem: incentivizes only saying "yes" when very sure (or never).
Okay, what's really important is the fraction of all real cancer cases that you correctly identify.
Recall = $\frac{TP}{(TP + FN)}$
Exercise: Game this metric.
Problem: you get perfect recall if you say everyone has cancer.
Can't we just have one number? Sort of. Here's one that's hard to game:
F-score $= 2 *\frac{\textrm{precision } * \textrm{ recall}}{\textrm{precision } + \textrm{ recall}}$
Here's a visual summary (By Walber - Own work, CC BY-SA 4.0, https://commons.wikimedia.org/w/index.php?curid=36926283

Tuning a Binary Classifier
Sometimes your classifier will have a built-in threshold that you can tune. The simplest example is a simple threshold classifier that says "positive" if a single input feature exceeds some value, and negative otherwise.
Consider trying to predict sex (Male or Female) given height:
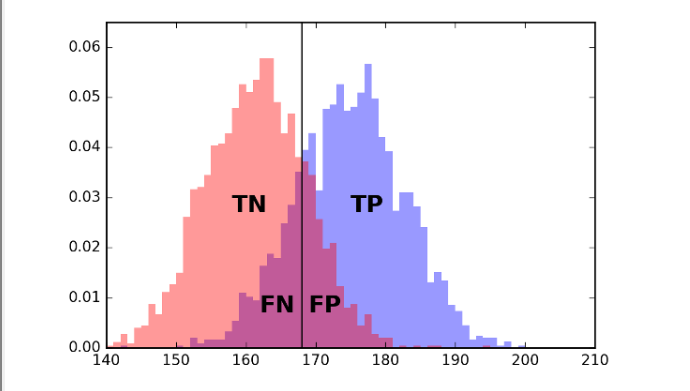
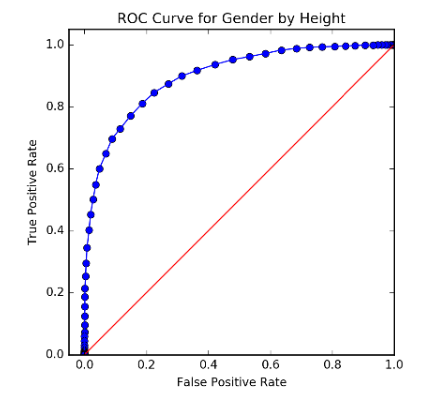
If you move the line left or right, you can trade off between error types (FP and FN).
The possibilities in this space of trade-offs can be summarized by plotting FP vs TP:
Metrics: Multi-Class Classification
Usually, a multiclass classifier will output a score or probability for each class; the prediction will then be the one with the highest score or probability.
Metrics:
- Accuracy - still possible, but random guess baseline gets worse fast, and good accuracy is very hard to get with many classes.
- Top-k accuracy: does the correct class lie in the $k$ most likely classes? Easier, and gives "partial credit"
- Precision and recall can be defined for each class:
- Precision for class $c$: $\frac{\textrm{\# correctly labeled } c}{\textrm{\# labeled class } c}$
- Recall for class $c$: $\frac{\textrm{\# correctly labeled } c}{\textrm{\# with true label } c}$
The full performance details can be represented using a confusion matrix:
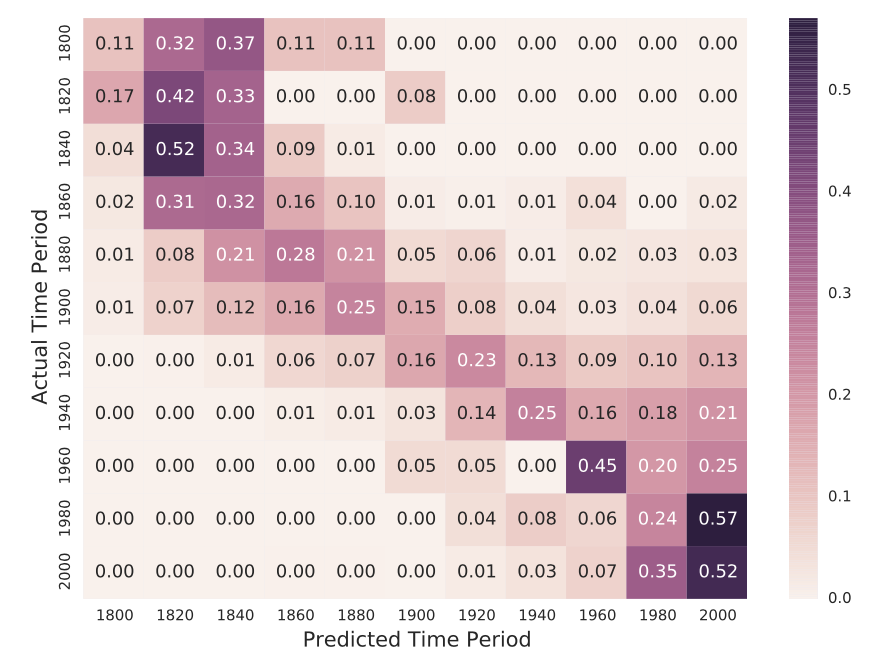
Exercises: Given a confusion matrix, how would you calculate:
- the precision for a certain class?
- the recall for a certain class?