Lecture 23 - Evaluating ML models: Metrics for Regression and Classification
Announcements
- Reminder: Lab 7 is due Sunday 11/30; no late penalty applied before 10pm Wednesday 12/3; no submissions accepted after that (not even via slip days)
Goals
- Know how to think about errors regression problems, and a few ways they can be measured.
- Regression: absolute, relative, squared; MSE, RMSE, MAE, coefficient of determination
- Binary Classification: accuracy, precision, recall, F-score
- Multiclass classification: acccuracy, precision, recall,
So you've made some predictions. How good are they?
Regression Metrics
Let's consider regression first. Our model is some function that maps an input datapoint to a numerical value:
$y_i^\mathrm{pred} = f(x_i)$
and we have a ground-truth value $y_i^\mathrm{true} $for $x_i$.
How do we measure how wrong we are?
Error is pretty simple to define:
$y_i^\mathrm{true} - y_i^\mathrm{pred}$
But we want to evaluate our model on the whole train or val set. Average error is a bad idea:
$\sum_i y_i^\mathrm{true} - y_i^\mathrm{pred}$
Absolute error solves this problem:
$|y_i^\mathrm{true} - y_i^\mathrm{pred}|$
Mean absolute error measures performance on a whole train or val set:
$\frac{1}{n} \sum_i |y_i^\mathrm{true} - y_i^\mathrm{pred}$|
Squared error disproportionately punishes larger errors. This may be desirable or not.
$\sum_i \left(y_i^\mathrm{true} - y_i^\mathrm{pred}\right)^2$
Mean squared error (MSE) does the same over a collection of training exaples:
$\frac{1}{n} \sum_i \left(y_i^\mathrm{true} - y_i^\mathrm{pred}\right)^2$
MSE becomes more interpretable if you square-root it, because now it's in the units of the input. This gives us Root Mean Squared Error (RMSE):
$\sqrt{ \frac{1}{n} \sum_i \left(y_i^\mathrm{true} - y_i^\mathrm{pred}\right)^2}$
Problem with any of the above:
You can make your error metric go as small as you want! Just scale the data: $$ X \leftarrow X / k $$ $$ \mathbf{y}^\mathrm{true} \leftarrow \mathbf{y}^\mathrm{true} / k $$ $$ \mathbf{y}^\mathrm{pred} \leftarrow \mathbf{y}^\mathrm{pred} / k $$
Also: Is 10 vs 12 is a bigger error than 1 vs 2?
Solutions:
Relative error:
$|y_i^\mathrm{true} - y_i^\mathrm{pred}|$
Coefficient of determination:
Let $\bar{y}$ be the mean of $\mathbf{y}^\mathrm{true}$.
Let $SS_\mathrm{tot} = \sum_i \left(y_i^\mathrm{true} - \bar{y}\right)$.
Let $SS_\mathrm{res} = \sum_i \left(y_i^\mathrm{true} - y_i^\mathrm{pred}\right)$.
Then the coefficient of determination is: $1 - \frac{SS_\mathrm{res}}{SS_\mathrm{tot}}$
This is:
- 0 if you predict the mean
- 1 if you're perfect
- negative if you do worse than the mean-prediction baseline!
Classification Metrics
Evaluating binary classification is trickier than regression, and the reason is that most intuitive metrics can be gamed using a well-chosen baseline.
Simplest metric - accuracy: on what % of the examples were you correct?
There are different kinds of right and wrong:
- TP - True positives (correctly labeled positive)
- TN - True negatives (correctly labeled negative)
- FP - False positives (incorrectly labeled positive; was actually negative)
- FN - False negatives (incorrectly labeled negative; was actually positive)

Exercise: let TP be the number of true positives, and so on for the other three. Define accuracy in terms of these quantities.
Accuracy = $\frac{TP + TN}{(TP + TN + FP + FN)}$
Exercise: Game this metric. Hint: suppose the classes are unbalanced (95% no-tumor, 5% tumor).
Problem: if you just say no cancer all the time, you get 95% accuracy.
Okay, what's really important is how often you're right when you say it's positive:
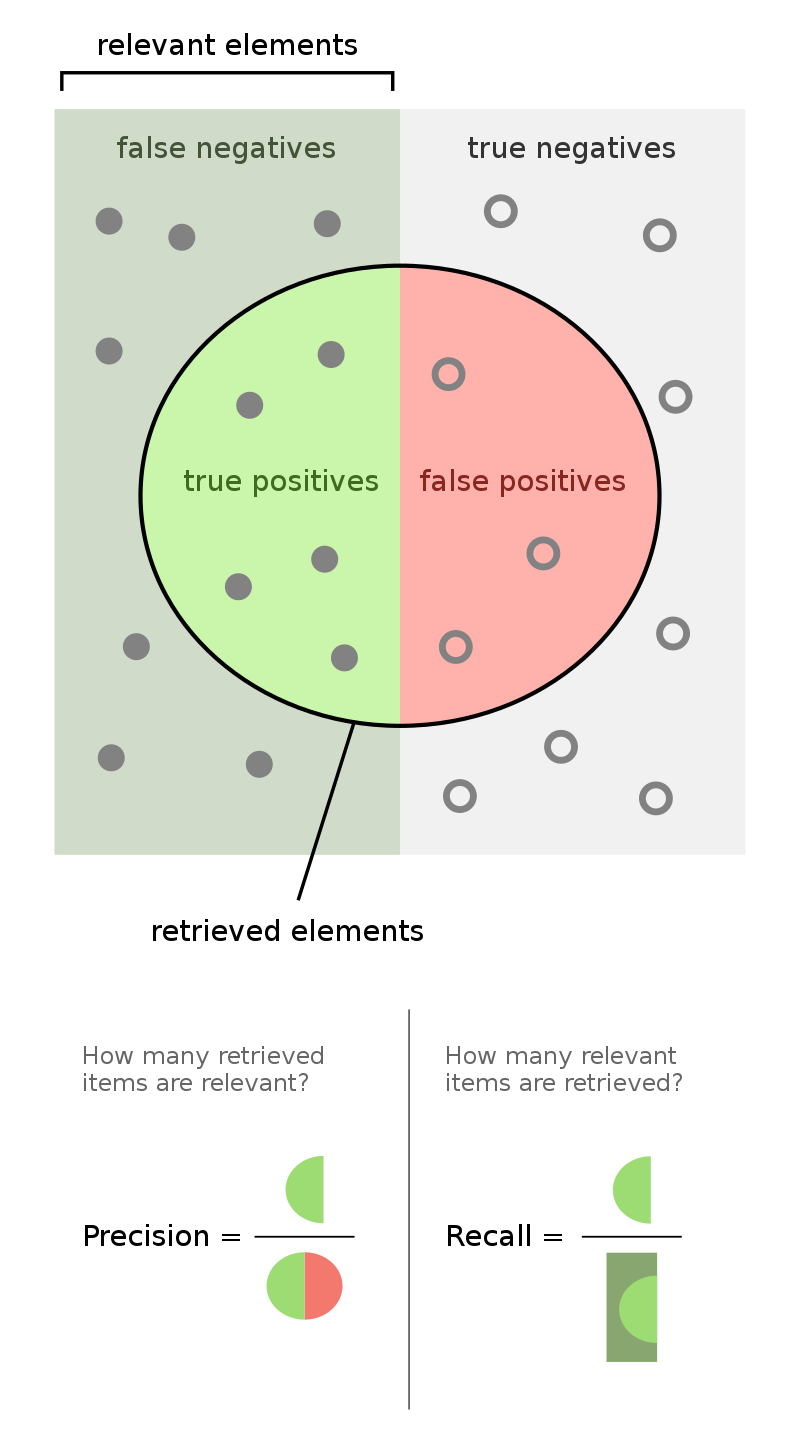
Precision = $\frac{TP}{(TP + FP)}$
Anything wrong with this?
Problem: incentivizes only saying "yes" when very sure (or never).
Okay, what's really important is the fraction of all real cancer cases that you correctly identify.
Recall = $\frac{TP}{(TP + FN)}$
Exercise: Game this metric.
Problem: you get perfect recall if you say everyone has cancer.
Can't we just have one number? Sort of. Here's one that's hard to game:
F-score $= 2 *\frac{\textrm{precision } * \textrm{ recall}}{\textrm{precision } + \textrm{ recall}}$
Here's a visual summary (source: Wikipedia):
Tuning a Binary Classifier
Sometimes your classifier will have a built-in threshold that you can tune. The simplest example is a simple threshold classifier that says "positive" if a single input feature exceeds some value, and negative otherwise.
Consider trying to predict sex (Male or Female) given height:
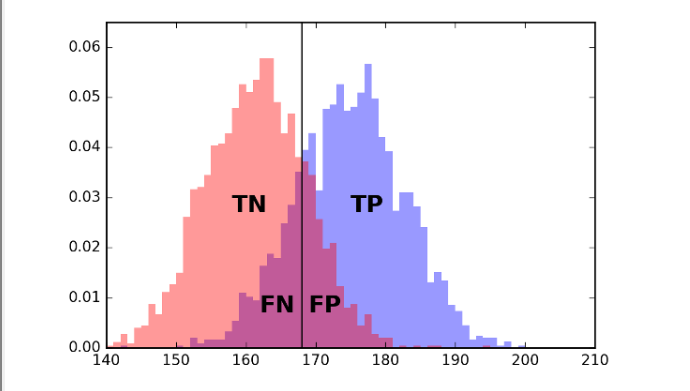
If you move the line left or right, you can trade off between error types (FP and FN).
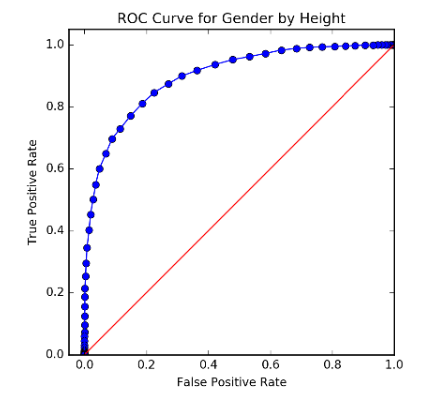
The possibilities in this space of trade-offs can be summarized by plotting FP vs TP:
Multi-Class Classification
Usually, a multiclass classifier will output a score or probability for each class; the prediction will then be the one with the highest score or probability.
Metrics:
- Accuracy - still possible, but random guess baseline gets worse fast, and good accuracy is very hard to get with many classes.
- Top-k accuracy: does the correct class lie in the $k$ most likely classes? Easier, and gives "partial credit"
- Precision and recall can be defined for each class:
- Precision for class $c$: $\frac{\textrm{\# correctly labeled } c}{\textrm{\# labeled class } c}$
- Recall for class $c$: $\frac{\textrm{\# correctly labeled } c}{\textrm{\# with true label } c}$
The full performance details can be represented using a confusion matrix:
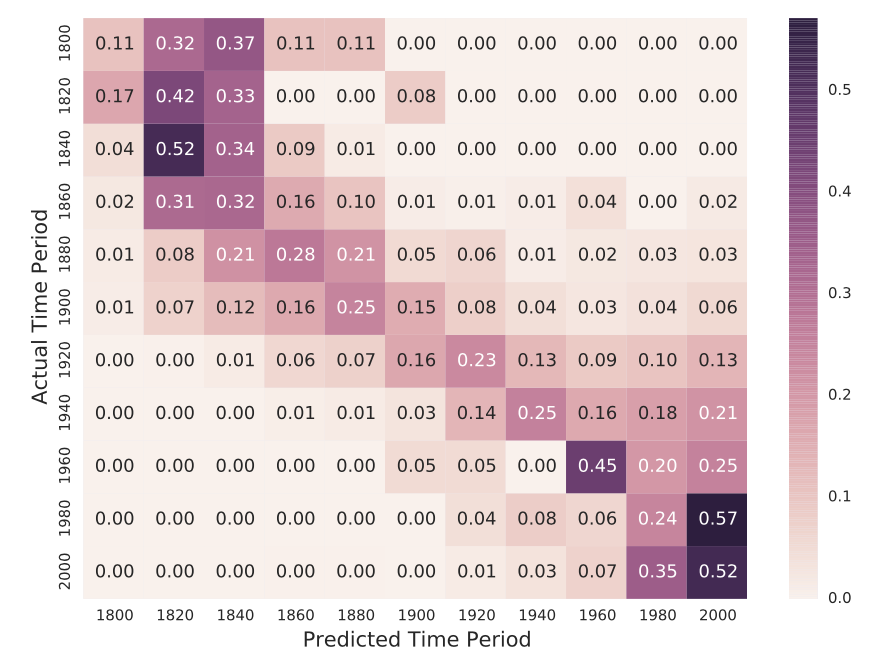
Exercises: Given a confusion matrix, how would you calculate:
- the precision for a certain class?
- the recall for a certain class?