Write the names of the students at your table:
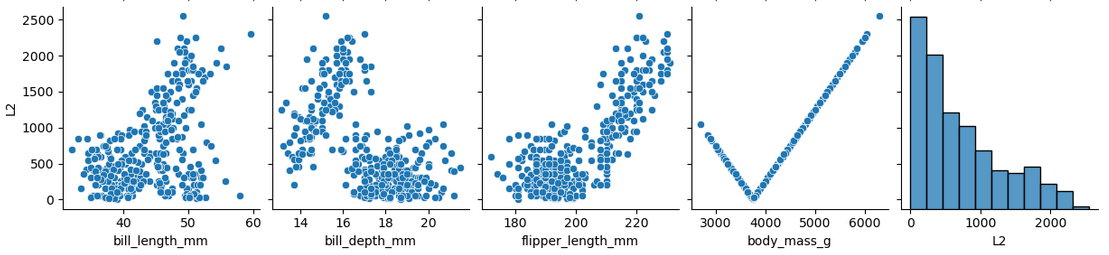
pairplot to see how the L2 distance relates to each
numerical column. Here’s the bottom row of that pairplot:
What’s happening here? Is this what we wanted? If not, why did this happen and what could we do about it?
What is the Hamming distance between each pair of the following three penguins, based only on the categorical features listed? Don’t coun the index column as a feature.
| island | sex | |
|---|---|---|
| 1 | Torgersen | Female |
| 338 | Biscoe | Female |
| 33 | Dream | Male |
Suppose you’re extracting features that will be used for distance comparisons among datapoints using some \(L^p\) distance. When would you want to choose ordinal encoding over one-hot encoding?