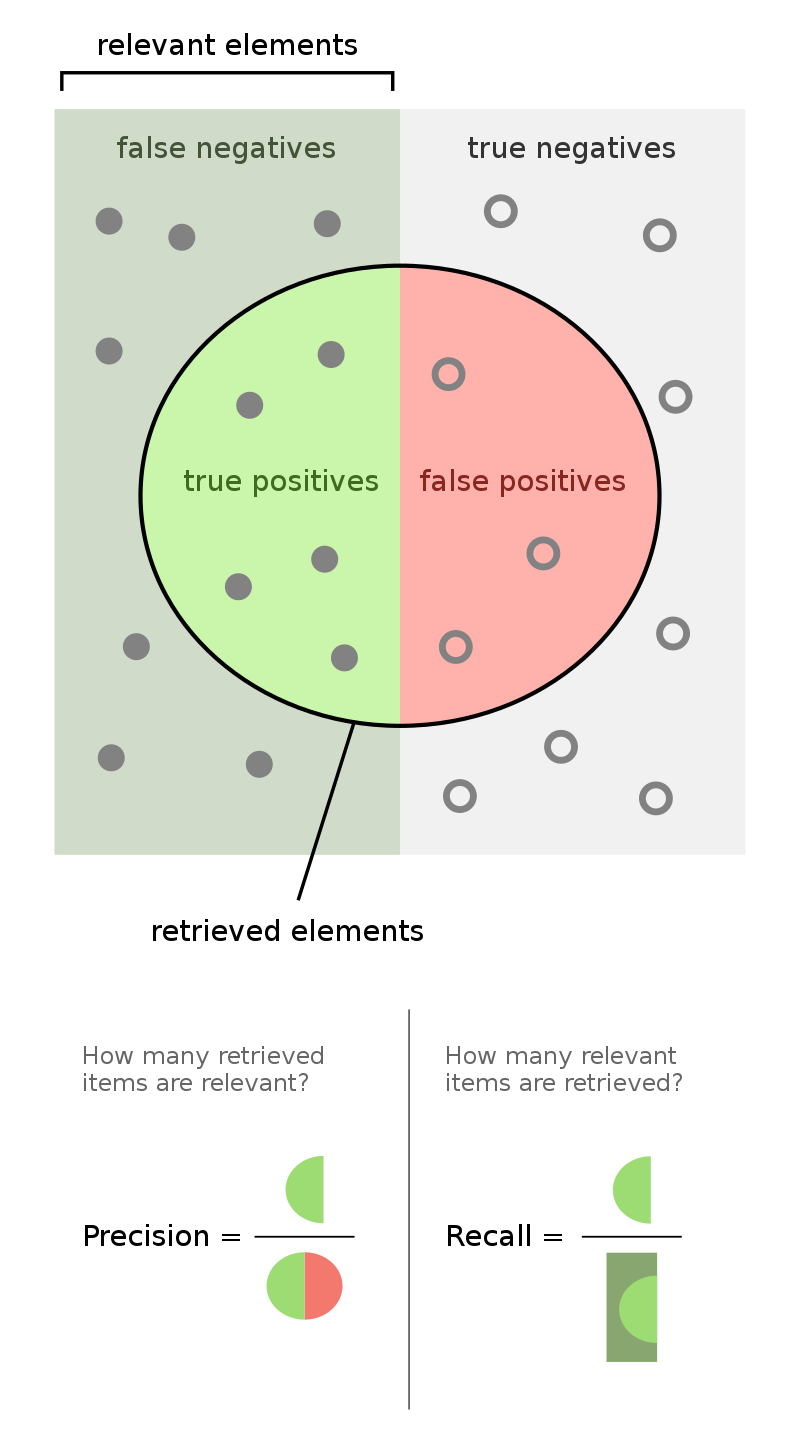
Here's a visual summary (source: Wikipedia):

FP milestone feedback:
Final exam logistics:
FP presentations tomorrow and Wednesday
Last time: linear classfiers: line seprates classes instead of hitting datapoints.
Many different types of classifiers exist; several flavors of linear as well as others.
See the classifier zoo for examples.
Evaluating binary classification is trickier than regression, and the reason is that most intuitive metrics can be gamed using a well-chosen baseline.
Simplest metric - accuracy: on what % of the examples were you correct?
There are different kinds of right and wrong:
Exercise: let TP be the number of true positives, and so on for the other three. Define accuracy in terms of these quantities.
Accuracy = $\frac{TP + TN}{(TP + TN + FP + FN)}$
Exercise: Game this metric. Hint: suppose the classes are unbalanced (95% no-tumor, 5% tumor).
Problem: if you just say no cancer all the time, you get 95% accuracy.
Okay, what's really important is how often you're right when you say it's positive:
Precision = $\frac{TP}{(TP + FP)}$
Anything wrong with this?
Problem: incentivizes only saying "yes" when very sure (or never).
Okay, what's really important is the fraction of all real cancer cases that you correctly identify.
Recall = $\frac{TP}{(TP + FN)}$
Exercise: Game this metric.
Problem: you get perfect recall if you say everyone has cancer.
Can't we just have one number? Sort of. Here's one that's hard to game:
F-score $= 2 *\frac{\textrm{precision } * \textrm{ recall}}{\textrm{precision } + \textrm{ recall}}$
Here's a visual summary (source: Wikipedia):

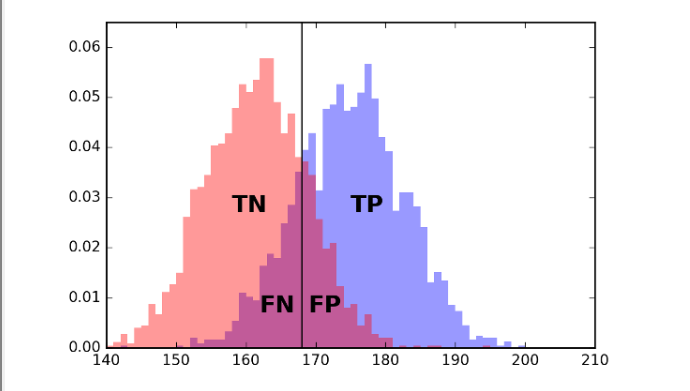
Sometimes your classifier will have a built-in threshold that you can tune. The simplest example is a simple threshold classifier that says "positive" if a single input feature exceeds some value, and negative otherwise.
Consider trying to predict sex (Male or Female) given height:

If you move the line left or right, you can trade off between error types (FP and FN).
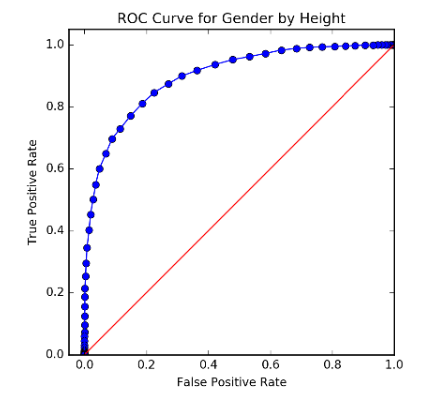
The possibilities in this space of trade-offs can be summarized by plotting FP vs TP:

Usually, a multiclass classifier will output a score or probability for each class; the prediction will then be the one with the highest score or probability.
The full performance details can be represented using a confusion matrix:

Exercises: Given a confusion matrix, how would you calculate: