Lecture 7 - Plots

Types, How to Make Them, and When to Use Them

Announcements

Talks:

  • Today 1/24 Fuqun Huang 4pm CF 025 - Teaching Demo

Title: The Concepts of Object, Class, Message and Method

Abstract: This teaching demonstration will introduce the core

concepts in Object Oriented Design (CSCI 345): Object, Class,
Message, and Method. In addition to learning these concepts and the
relations between them, we’ll have an interactive practice of
extracting these concepts in a real situation that involves
everyone in the classroom. You will also take home a mysterious
artifact (“homework” that can only be found in Dr. Huang’s class ☺)
that reflects the beauty of nature. If nature were created by a
programmer, how would he/she have used the object-oriented concepts
to achieve high efficiency and reusability? Let’s find out!

  • Thu 1/26 Kritagya Upadhyay 4pm CF 105 - Research (blockchain applications, artificial intelligence, and cyber security)
  • Fri 1/27 Kritagya Upadhyay 4pm CF 316 - Teaching
In [ ]:

Quiz 2 FMQs:

  • T/F All numbers in pandas tables are represented using python’s native int and float types.
  • T/F A CSV file is an example of unstructured data.
  • T/F All possible values of a random variable must sum to 1.

First, a fair coin is flipped. If the first coin comes up heads, the second flip is of a fair coin; otherwise, the second flip is a weighted coin that comes up heads with probability 0.2 and tails with probability 0.8. Let A and B be the outcomes of the first and second coin flip, respectively. A heads outcome is denoted H, and tails is written as T.

  • What is P(A=H, B=T)?
  • What is P(B=H | A=T)?
In [ ]:

Goals

Know how to produce, interpret, and choose when to use several of the most commonly used types of data visualizations:

  • Tables
  • Dot and line plots
  • Box and whisker plots
  • Scatter plots
  • Bar/column plots and (usually not) pie charts
  • Histograms
In [25]:
import pandas as pd
import seaborn as sns
import matplotlib.pyplot as plt

penguins = sns.load_dataset("penguins")
fmri = sns.load_dataset("fmri")
mpg = sns.load_dataset("mpg")
In [26]:
penguins
Out[26]:
species island bill_length_mm bill_depth_mm flipper_length_mm body_mass_g sex
0 Adelie Torgersen 39.1 18.7 181.0 3750.0 Male
1 Adelie Torgersen 39.5 17.4 186.0 3800.0 Female
2 Adelie Torgersen 40.3 18.0 195.0 3250.0 Female
3 Adelie Torgersen NaN NaN NaN NaN NaN
4 Adelie Torgersen 36.7 19.3 193.0 3450.0 Female
... ... ... ... ... ... ... ...
339 Gentoo Biscoe NaN NaN NaN NaN NaN
340 Gentoo Biscoe 46.8 14.3 215.0 4850.0 Female
341 Gentoo Biscoe 50.4 15.7 222.0 5750.0 Male
342 Gentoo Biscoe 45.2 14.8 212.0 5200.0 Female
343 Gentoo Biscoe 49.9 16.1 213.0 5400.0 Male

344 rows × 7 columns

In [27]:
fmri.sort_values(by="subject")
Out[27]:
subject timepoint event region signal
1063 s0 0 cue parietal -0.006899
112 s0 11 stim parietal -0.051469
897 s0 12 cue parietal -0.036943
294 s0 2 stim frontal -0.009038
910 s0 11 cue parietal -0.039002
... ... ... ... ... ...
722 s9 18 cue frontal -0.000643
725 s9 0 cue parietal -0.028993
216 s9 3 stim parietal 0.164446
687 s9 15 cue frontal 0.002170
745 s9 6 cue parietal 0.017309

1064 rows × 5 columns

In [28]:
mpg
Out[28]:
mpg cylinders displacement horsepower weight acceleration model_year origin name
0 18.0 8 307.0 130.0 3504 12.0 70 usa chevrolet chevelle malibu
1 15.0 8 350.0 165.0 3693 11.5 70 usa buick skylark 320
2 18.0 8 318.0 150.0 3436 11.0 70 usa plymouth satellite
3 16.0 8 304.0 150.0 3433 12.0 70 usa amc rebel sst
4 17.0 8 302.0 140.0 3449 10.5 70 usa ford torino
... ... ... ... ... ... ... ... ... ...
393 27.0 4 140.0 86.0 2790 15.6 82 usa ford mustang gl
394 44.0 4 97.0 52.0 2130 24.6 82 europe vw pickup
395 32.0 4 135.0 84.0 2295 11.6 82 usa dodge rampage
396 28.0 4 120.0 79.0 2625 18.6 82 usa ford ranger
397 31.0 4 119.0 82.0 2720 19.4 82 usa chevy s-10

398 rows × 9 columns

Matplotlib

In [29]:
colors = {"Adelie": "red", "Gentoo": "green", "Chinstrap": "blue"}
size = lambda x: 10 if x > 40 else 1
plt.scatter("body_mass_g", "flipper_length_mm", data=penguins,
            c=penguins["species"].map(colors),
            s=(penguins["bill_length_mm"])/4)
plt.legend()
plt.xlabel("Body Mass (g)")
plt.ylabel("Flipper Length (mm)")
Out[29]:
Text(0, 0.5, 'Flipper Length (mm)')

Seaborn

In [30]:
sns.relplot(x="body_mass_g", y="flipper_length_mm",
            hue="species", size="bill_depth_mm", data=penguins)
Out[30]:
<seaborn.axisgrid.FacetGrid at 0x7f6ff9b4afa0>

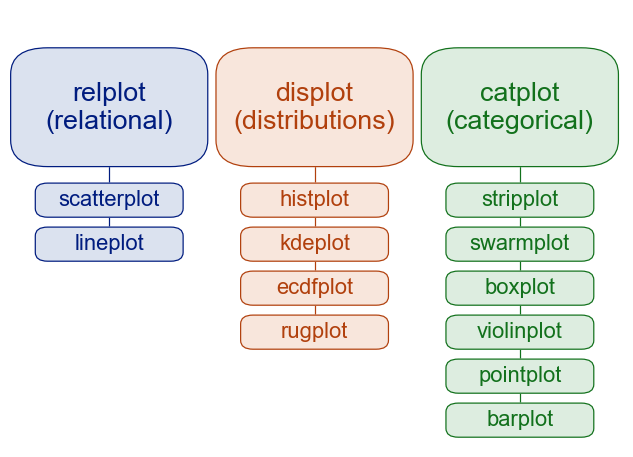
Key distinction: figure-level vs. axes-level: https://seaborn.pydata.org/tutorial/function_overview.html

Common Data Visualizations

Tables

Suppose you want to see the 5 biggest penguins.

In [31]:
penguins.sort_values("body_mass_g", ascending=False).iloc[:5,:]
Out[31]:
species island bill_length_mm bill_depth_mm flipper_length_mm body_mass_g sex
237 Gentoo Biscoe 49.2 15.2 221.0 6300.0 Male
253 Gentoo Biscoe 59.6 17.0 230.0 6050.0 Male
297 Gentoo Biscoe 51.1 16.3 220.0 6000.0 Male
337 Gentoo Biscoe 48.8 16.2 222.0 6000.0 Male
331 Gentoo Biscoe 49.8 15.9 229.0 5950.0 Male

Table Tips:

  • Think about row and column ordering
  • Label columns and rows well (clear but concise).
  • Uniform precision, right-justified numbers.
  • Sometimes: bold or emphasize max or min values in a column
In [32]:
p = penguins.rename(columns={"species": "Species", "island": "Island",
                 "bill_length_mm": "Bill Length (mm)","bill_depth_mm": "Bill Depth (mm)",
                 "flipper_length_mm": "Flipper Length (mm)", "body_mass_g": "Body Mass (g)",
                 "sex": "Sex"})
p = p[["Species", "Island", "Sex", "Body Mass (g)", "Bill Length (mm)", "Bill Depth (mm)", "Flipper Length (mm)"]]
p.sort_values("Body Mass (g)", ascending=False).iloc[:5,:]
Out[32]:
Species Island Sex Body Mass (g) Bill Length (mm) Bill Depth (mm) Flipper Length (mm)
237 Gentoo Biscoe Male 6300.0 49.2 15.2 221.0
253 Gentoo Biscoe Male 6050.0 59.6 17.0 230.0
297 Gentoo Biscoe Male 6000.0 51.1 16.3 220.0
337 Gentoo Biscoe Male 6000.0 48.8 16.2 222.0
331 Gentoo Biscoe Male 5950.0 49.8 15.9 229.0

Dot plots, Line Plots

Conceptually (but not technically) different from a scatter plot, in that $x$ values are assumed to be ordered.

In [33]:
mpg_year = mpg.groupby("model_year").mean()
mpg_year
Out[33]:
mpg cylinders displacement horsepower weight acceleration
model_year
70 17.689655 6.758621 281.413793 147.827586 3372.793103 12.948276
71 21.250000 5.571429 209.750000 107.037037 2995.428571 15.142857
72 18.714286 5.821429 218.375000 120.178571 3237.714286 15.125000
73 17.100000 6.375000 256.875000 130.475000 3419.025000 14.312500
74 22.703704 5.259259 171.740741 94.230769 2877.925926 16.203704
75 20.266667 5.600000 205.533333 101.066667 3176.800000 16.050000
76 21.573529 5.647059 197.794118 101.117647 3078.735294 15.941176
77 23.375000 5.464286 191.392857 105.071429 2997.357143 15.435714
78 24.061111 5.361111 177.805556 99.694444 2861.805556 15.805556
79 25.093103 5.827586 206.689655 101.206897 3055.344828 15.813793
80 33.696552 4.137931 115.827586 77.481481 2436.655172 16.934483
81 30.334483 4.620690 135.310345 81.035714 2522.931034 16.306897
82 31.709677 4.193548 128.870968 81.466667 2453.548387 16.638710

No connected dots - technically the same as a scatter plot.

In [34]:
sns.relplot(x="model_year", y="mpg", kind="scatter", data=mpg_year)
Out[34]:
<seaborn.axisgrid.FacetGrid at 0x7f6ff9b3d100>

Connect the dots: now you have a line plot:

In [35]:
sns.relplot(x="model_year", y="mpg", kind="line", data=mpg_year)
Out[35]:
<seaborn.axisgrid.FacetGrid at 0x7f6ff9c560a0>

Seaborn does sensible things if you have multiple datapoints per $x$ value:

In [36]:
sns.relplot(x="model_year", y="mpg", kind="line", data=mpg)
Out[36]:
<seaborn.axisgrid.FacetGrid at 0x7f6ff9aec700>

Quandry: when should you connect the dots?

Box and whisker plots

In [37]:
sns.boxplot(x="species", y="body_mass_g", data=penguins)
Out[37]:
<matplotlib.axes._subplots.AxesSubplot at 0x7f6ff993d700>

Think Pair Share: Of the ones we've discussed so far (table, dot/line, box and whisker), which kind of visualization would you use to illustrate each of the following?

  1. The number of cars per model year in the MPG dataset
  2. The distribution of each penguin body measurement, independent of species.
  3. The centrality and variability of each penguin body measurement per species.

Scatter plots

In [38]:
sns.relplot(data=penguins, x="flipper_length_mm", y="bill_length_mm", hue="species")
Out[38]:
<seaborn.axisgrid.FacetGrid at 0x7f6ff98b2130>

Bar/column plots and (usually not) pie charts

In [39]:
sns.catplot(x="species", data=penguins, kind="count")
Out[39]:
<seaborn.axisgrid.FacetGrid at 0x7f6ff9b20bb0>
In [40]:
sns.catplot(x="species", data=penguins, kind="count", col="island")
Out[40]:
<seaborn.axisgrid.FacetGrid at 0x7f6ffb603c10>
In [41]:
sns.catplot(x="species", data=penguins, kind="count")
Out[41]:
<seaborn.axisgrid.FacetGrid at 0x7f6ff9787580>

Histograms

In [42]:
sns.displot(penguins, x="flipper_length_mm")
Out[42]:
<seaborn.axisgrid.FacetGrid at 0x7f6ff96fb9a0>
In [43]:
sns.displot(penguins, x="flipper_length_mm", stat='density')
Out[43]:
<seaborn.axisgrid.FacetGrid at 0x7f6ff9669100>
In [44]:
sns.displot(penguins, x="flipper_length_mm", col='species')
Out[44]:
<seaborn.axisgrid.FacetGrid at 0x7f6ff9926df0>
In [45]:
sns.displot(penguins, x="flipper_length_mm", hue="species", stat="density")
Out[45]:
<seaborn.axisgrid.FacetGrid at 0x7f6ff98306a0>
In [46]:
sns.displot(penguins, x="flipper_length_mm", hue="species", col="island")
Out[46]:
<seaborn.axisgrid.FacetGrid at 0x7f6ff9437400>
In [47]:
sns.displot(penguins, x="flipper_length_mm", hue="species", col="island", kde='True')
Out[47]:
<seaborn.axisgrid.FacetGrid at 0x7f6ff9393520>
In [48]:
sns.jointplot(x="bill_length_mm", y="bill_depth_mm", data=penguins, kind='hex')
Out[48]:
<seaborn.axisgrid.JointGrid at 0x7f6ff95bf310>
In [ ]:
fmri[fmri["subject"]=="s0"].sort_values(by="timepoint")

Think Pair Share: Of the ones we've discussed so far (table, dot/line, box and whisker), which kind of visualization would you use to illustrate each of the following?

  1. Average signal per subject in the fmri dataset.
  2. The signal over time for each event type in patient 0, regardless of region.
  3. The distribution of bill lengths for Adelie penguins.

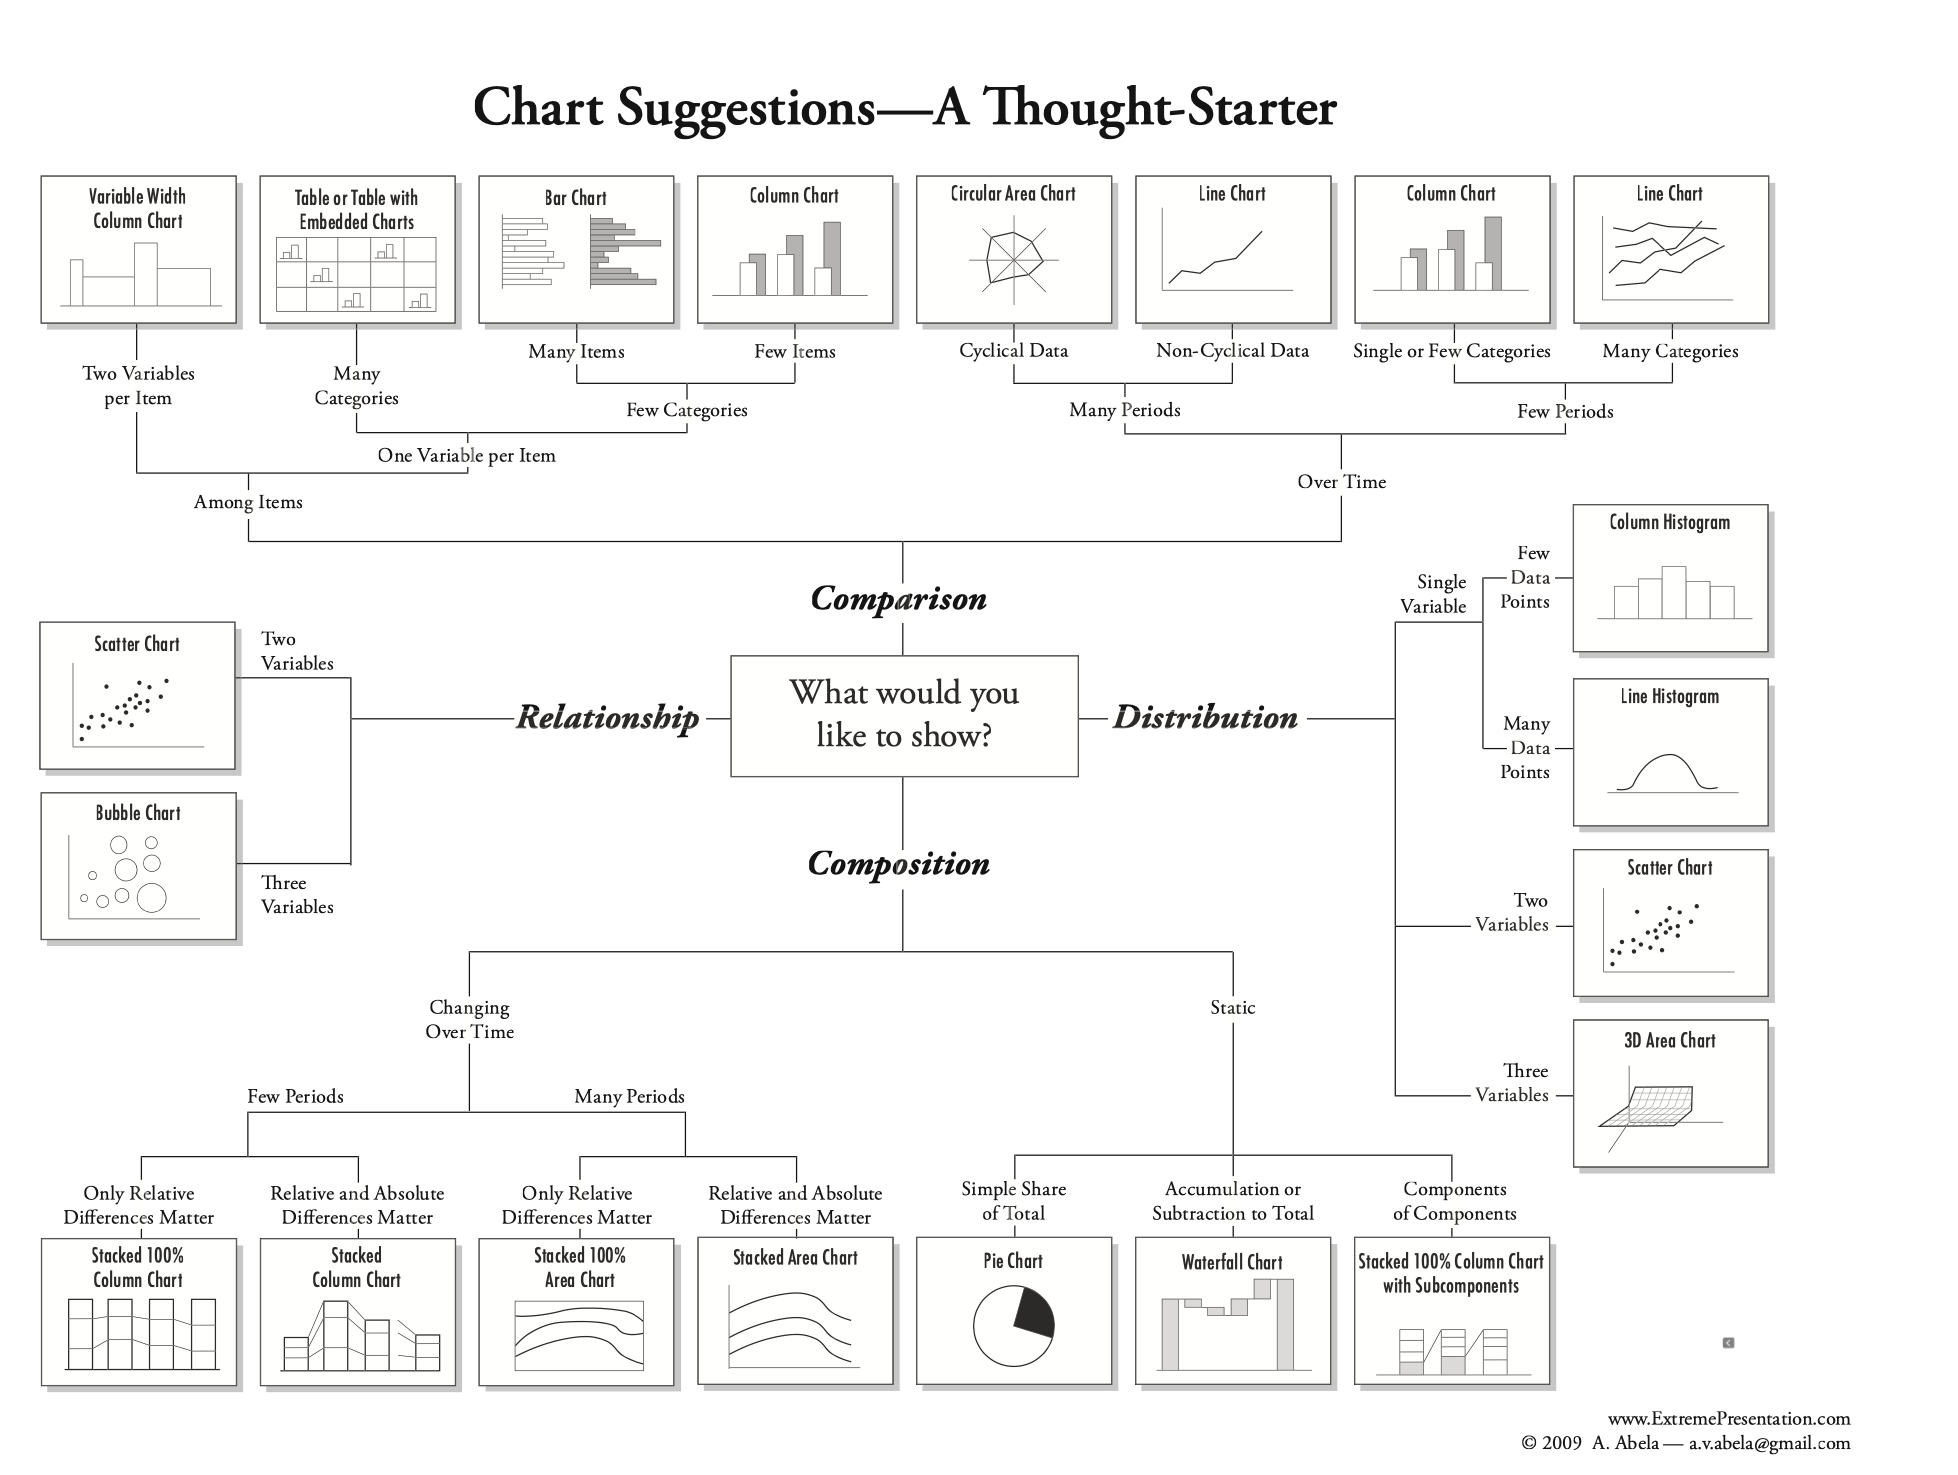
A helpful figure from the book: