This is trickier than regression, and the reason is that most intuitive metrics can be gamed using a well-chosen baseline.
Simplest metric - accuracy: on what % of the examples were you correct?
There are different kinds of right and wrong:
Exercise: let TP be the number of true positives, and so on for the other three. Define accuracy in terms of these quantities.
Accuracy = $\frac{TP + TN}{TP + TN + FP + FN}$
Exercise: Game this metric. Hint: suppose the classes are unbalanced (95% no-tumor, 5% tumor).
Okay, what's really important is how often you're right when you say it's positive:
Exercise: define a metric that captures this.
Precision = $\frac{TP}{TP + FP}$
Anything wrong with this? Hint: there is cancer involved.
Okay, what's really important is how often you miss a real case of cancer.
the fraction of real cancer cases that you correctly identify.
Exercise: define a metric that captures this.
Recall = $\frac{TP}{(TP + FN)}$
Exercise: Game this metric.
Can't we just have one number? Sort of. Here's one that's hard to game:
F-score $= 2 *\frac{\textrm{precision } * \textrm{ recall}}{\textrm{precision } + \textrm{ recall}}$
Sometimes your classifier will have a built-in threshold that you can tune. The simplest example is a simple threshold classifier that says "positive" if a single input feature exceeds some value, and negative otherwise.
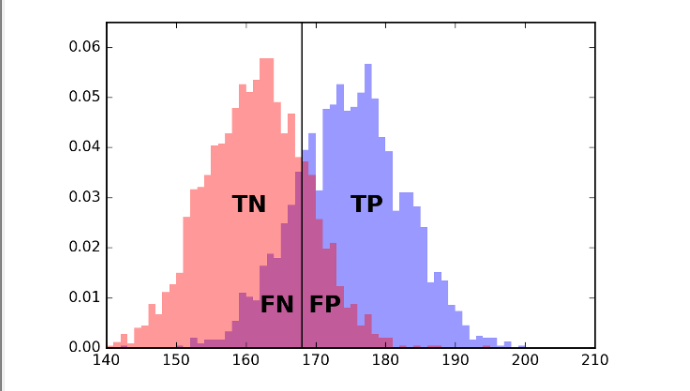
Consider trying to predict sex (Male or Female) given height:
If you move the line left or right, you can trade off between error types (FP and FN).
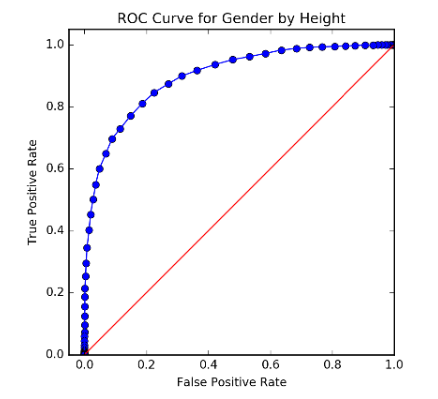
The possibilities in this space of trade-offs can be summarized by plotting FP vs TP:
Edited to add:
Exercise:
Usually, a multiclass classifier will output a score or probability for each class; the prediction will then be the one with the highest score or probability.
The full details can be represented using a confusion matrix: