Lecture 23 - Machine Learning Overview and Taxonomy

Announcements:

Goals:

What the heck is ~all this hype~ machine learning about?

A programmer's perspective:

It's a tool that we can use when we don't know how to just write the code to compute the answer.

A data scientist's perspective:

A mathematical / probabilistic perspective:

Given a set of data $X$ and (possibly) labels $y$ (i.e., quantities to predict), model either $P(y | x)$ or $P(x, y)$.

Recall: If you know $P(x, y)$, you can compute $P(y | x)$:

$$P(y | x) = \frac{P(x, y)}{P(x)}$$

and $$P(x) = \sum_i P(x,y_i)$$

Terminology and Problem Setup

Feature Vectors

Machine learning only works on vectors. If you have something else (text, images, penguins, bananas), you'll need to convert them to vectors first.

These vectors are called feature vectors; each dimension is an individual feature; in this course we've been calling these columns.

The process of going from things to feature vectors is called feature extraction.

Observation: vectors can only contain numbers, so categorical columns usually need to be either dropped or converted to numbers somehow.

Dataset and Labels

We'll assume that we have a collection of a bunch of feature vectors (we've been calling it a table), one for each datapoint. This is our dataset.

A collection of vectors can be packaged into a matrix. The traditional way to do this is to call it $X$ and arrange the dimensions it like we're used to with our tables, so $X_{n \times d}$ contains $n$ rows, each of which is a $d$-dimensional feature vector for a datapoint.

Sometimes, we also have values for some quantity we'd like to predict, one value per datapoint in our dataset. These are called labels, and traditionally written $\mathbf{y}_{n \times 1}$, so $y_i$ is the label for the $i$th row of $X$.

Note: The word "label" may connote that it is categorical, but this is not necessarily true.

Problem Statement

Given $X$:

Given $X$ and $\mathbf{y}$:

Examples:

We generally go about this by training (i.e., fitting) a model to our dataset $X$.
Exercise: Use ALL the words!

Exercise: You are given a collection of images. Some of them contain cats and some do not, and you have a column in a dataframe that tells you which are which. Without going into specifics of how the steps are accomplished, tell me a story about how you can use machine learning to automatically predict whether an image has a cat or not. Your story should use the following words:

cat.jpg

Taxonomic Considerations

Classification vs Regression

You know this one!

Supervised vs Unsupervised

Supervised Learning, by example:

Key property: a dataset $X$ with corresponding "ground truth" labels $\mathbf{y}$ is available, and we want be able to to predict a $y$ given a new $\mathbf{x}$.

Unsupervised Learning, by example:

Key property: you aren't given "the right answer" - you're looking to discover structure in the data.

Discriminative vs Generative

For the moment, let's focus on supervised classification for the moment. In this case, $\mathbf{x}$ is a vector and $y$ is a discrete label indicating one of a set of categories or classes.

Discriminative models try to estimate $P(y | \mathbf{x})$. If you know this, then pick the most likely label, i.e., the $y$ that maximizes $P(y | \mathbf{x})$, and that's your predicted label for $\mathbf{x}$.

Generative models try to estimate $P(\mathbf{x})$ (if there are no labels $y$), or $P(x, y)$ if labels exist.

Note: it's easy to conclude that classification and discriminative are the same thing; they're not! Classifiers are often discriminative, but not always. How does that work?

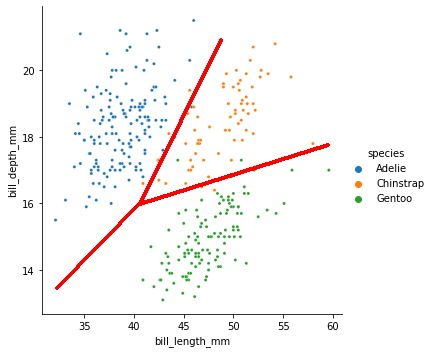
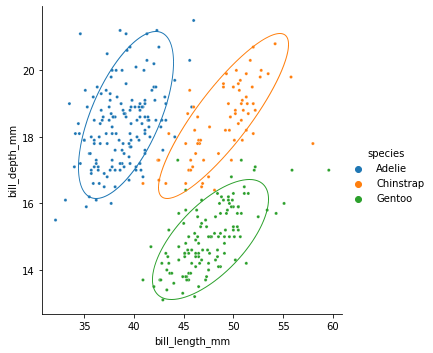
Consider two schemes for classifying penguin species given their bill length and depth.

Exercise: Which of these is generative and which is discriminative?

  1. Draw lines through the space and classify based on which area the penguin is in: penguins2.png
  2. Fit 2D Gaussian distributions to the three species, and classify based on which Gaussian says a point is most probable: penguins2.png

Exercises:

  1. Automatically detecting outlier images - like lab 4, except fully automatic.

    • Classification, regression, or neither?
    • Supervised or unsupervised?
  2. Using linear regression (i.e., a best-fit line) to predict home value based on square feet.

    • Classification, regression, or neither?
    • Supervised or unsupervised?
  3. Finding "communities" of people who frequently interact with each other on a social network.

    • Classification, regression, or neither?
    • Supervised or unsupervised?

Assumptions

Data distribution

Generally: unseen data is drawn from the same distrubtion as your dataset.

Consequence: We don't assume correlation is causation, but we do assume that observed correlations will hold in unseen data.

Specific models: many more! Example:

Linear regression assumes: