Lecture 20 - Plots

Viz Types, How to Make Them, and When to Use Them

Announcements:

Goals:

Know how to produce, interpret, and choose when to use several of the most commonly used types of data visualizations:

Matplotlib

Seaborn

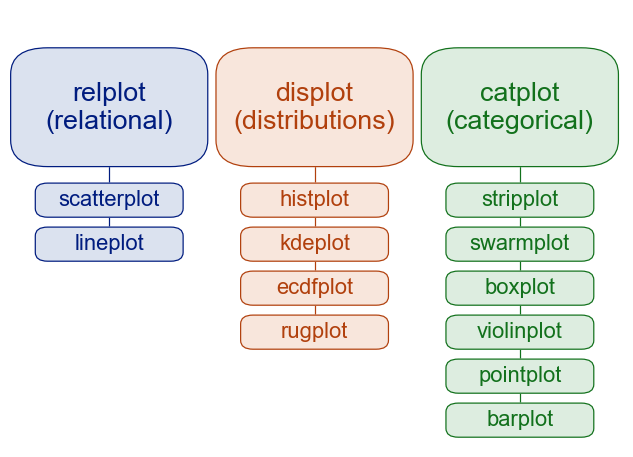
Key distinction: figure-level vs. axes-level: https://seaborn.pydata.org/tutorial/function_overview.html

Common Data Visualizations

Tables

Suppose you want to see the 5 biggest penguins.

Discuss: When should you use this? What are its strengths and weakenesses?

Table Tips:

Dot plots, Line Plots

Conceptually (but not technically) different from a scatter plot, in that $x$ values are assumed to be ordered.

No connected dots - technically the same as a scatter plot.

Connect the dots: now you have a line plot:

Seaborn does sensible things if you have multiple datapoints per $x$ value:

Discuss: When should you use this? What are its strengths and weakenesses?

Also: when should you connect the dots?

Box and whisker plots

Discuss: When should you use this? What are its strengths and weakenesses?

Scatter plots

Discuss: When should you use this? What are its strengths and weakenesses?

Bar/column plots and (usually not) pie charts

Discuss: When should you use this? What are its strengths and weakenesses?

Histograms

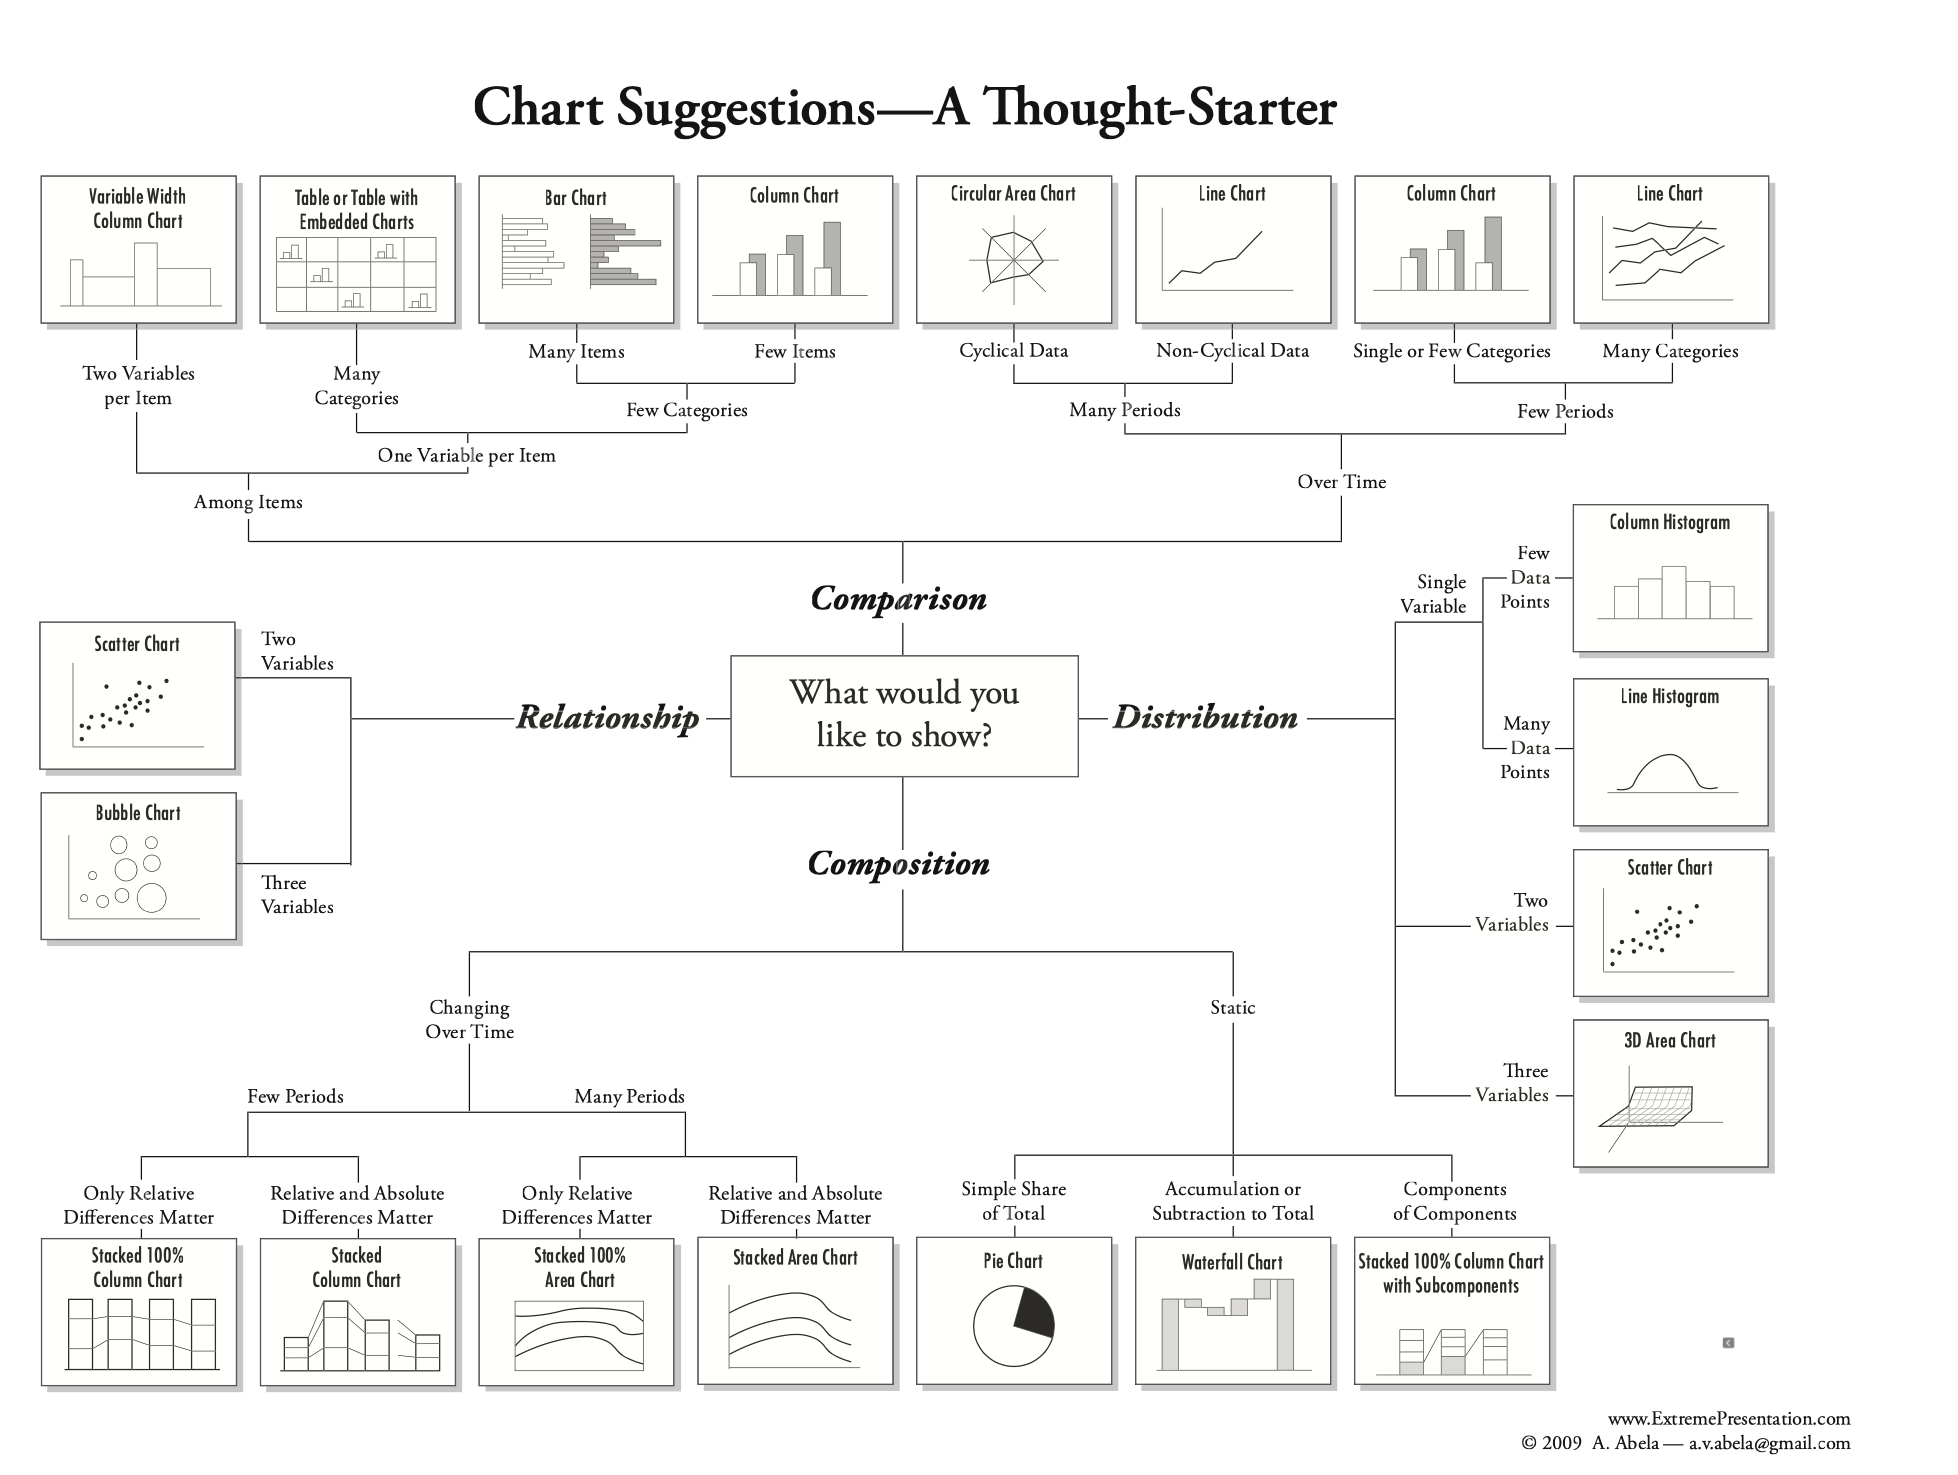
A helpful figure from the book: